 |
 |
Bill Brodhead WPB Enterprises Inc
Radon & Vapor Intrusion |
 |
|
|
|
Bill Brodhead WPB Enterprises Inc.
Radon & Vapor Intrusion |
|
|
|
|
|
|
WPB Radon Fan Testing MethodReasonably accurate airflow measurements in piping requires sensitive instruments, numerous pressure measurements, measurements of test site conditions, roper testing setup and mostly careful calibration of the velocity pressure measuring device.
|
|
|
WPB Radon Fan Testing MethodReasonably accurate airflow measurements in piping requires sensitive instruments, numerous pressure measurements, measurements of test site conditions, roper testing setup and mostly careful calibration of the velocity pressure measuring device.
|
|
|
|
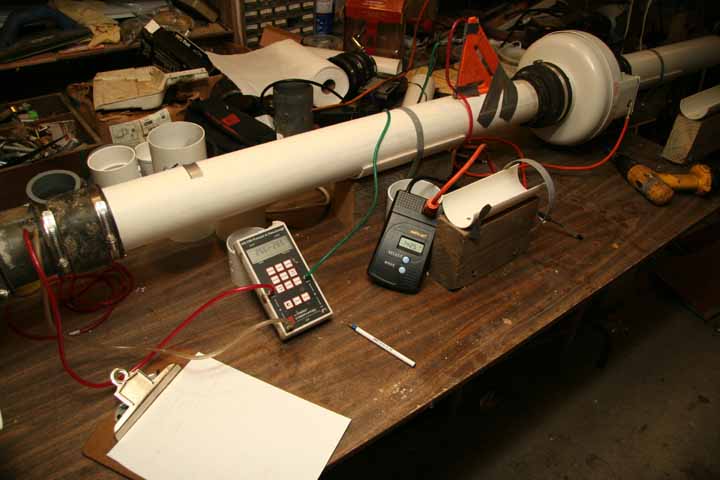
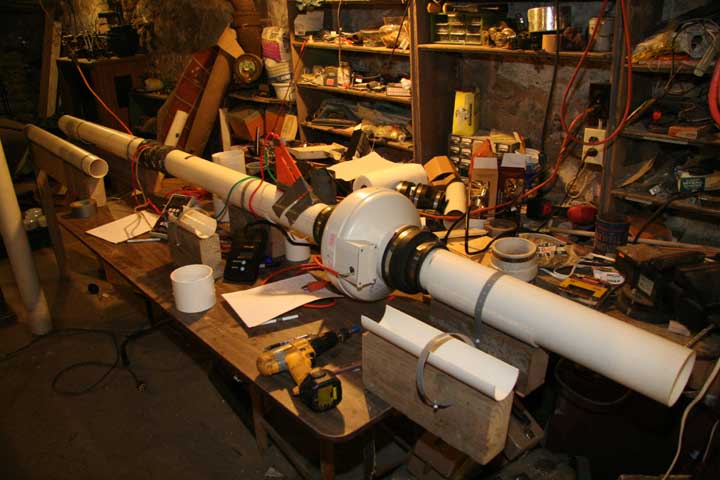
This comparison of fan performance was undertaken to be able to compare all the generic radon fans by testing them under identical conditions. A fan testing station was set up at WPB offices. See photo below. Since most sub-slab depressurization systems require at least 10 feet of PVC piping to be able to carry the system exhaust above the roof line all fans were tested with 10 feet of piping. In most cases 4" PVC piping was used. Higher capacity fans were tested with 6 inch PVC piping since this would be the typical minimum piping size for larger airflow setups often used in commercial installations. The drawing below gives the general testing system layout.
|
|
Fan Testing Layout |
|
 |
 |
||
 |
 |
|
|
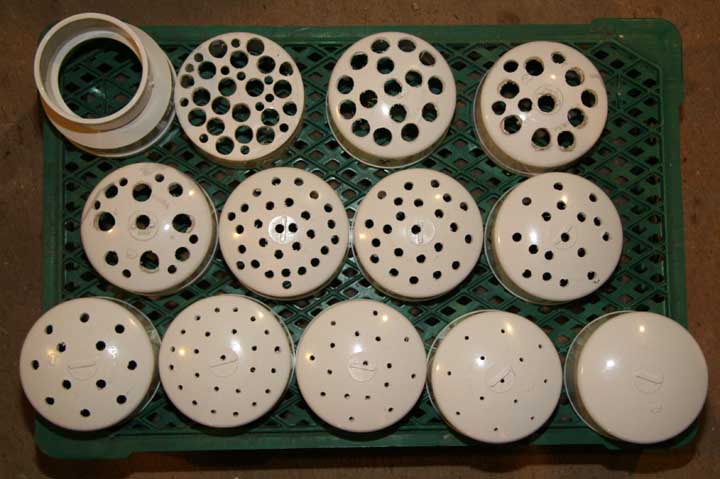
The measurement of each fan performance was carried out by making measurements of the velocity pressure using a flow grid placed in the piping and measuring the static pressure using the reference port of a pitot tube placed in the piping. The inlet to the system had varying amounts of restriction from full open to fully capped. See restriction caps in photo above. During each restriction the velocity pressure, static pressure and wattage were measured and recorded. The micro-monometer was a Energy Conservatory DG-700 that has automatic zeroing and is capable of reading down to 0.1 pascals with a margin of error of one percent. All pressure readings were ten second averages. This study was designed to make measurements that have a total measurement error less than 10%. It was discovered during the testing that at zero airflow the maximum static pressure of each fan would decrease 3% to 6% over an hour's time as the fan motor heated up. The current testing procedure is to record the capped pipe static pressure after the fan has run for one hour at zero airflow and then run the fan with the smallest inlet size cap for 30 minutes to allow the fan motor to obtain normal airflow temperature. The smallest inlet cap only creates about a 1% drop in static pressure from heat generation. The remaining restriction caps are each then tested in sequence without long run times. The fan wattage was measured using a "Watts Up?/Pro" electric watt meter available from Watt Meter. A critical component of measuring fan performance is having a flow measuring device that has been calibrated. This study used a pitot tube flow grid that was provided by Infiltec. Infiltec is an infiltration instrument manufacturer that makes blower doors used in measuring building airtightness. The flow grid velocity pressure was measured under 10 different known airflow velocities at the RadonAway fan manufacturer factory in their fan testing laboratory. The average of these measurements at the nine higher airflow rates was averaged. The average calibration factor that cross referenced to the airflow velocities was used as the calibration factor for all the fan performance tests. Airflow velocity measurements are influenced by the air density at the time of the measurement. To adjust for this factor the air density was calculated during each fan performance testing run. This was done by measuring the test site temperature and humidity. The current barometric measurement was determined by checking the local weather on the internet for the nearest town. The calculation of the air density was made by using a NIST simplified air density formula. The NIST formula provided here needs to be converted from metric units to english units. The velocity pressure conversion to CFM is then determined by using the flowgrid calibration factor previously determined and the air density using the following formula.
CFM = FGCF x square root of FGVP / AD Where: CFM - cubic feet per minute FGCF - Flowgrid calibration factor FGVP - Flowgrid velocity pressure in inches of water column AD - Air density in lbs/cubic foot (use 0.075 if unknown)
The static pressure induced by the fans under differing airflow and resistance was measured by placing a pitot tube in the middle of the air stream approximately 12" before the inlet to the fan. The reference side of the pitot tube was then measured with ten second averages using the same dual channel micro-monometer. There is approximately three additional feet of open piping from the pitot tube to the fan exhaust location. This small amount of resistance was added to the static pressure reading by mathematically calculating the resistance based on the system airflow and a factor determined from an ASHRAE piping airflow pressure loss in piping chart. The two additional feet of PVC piping added the following additional static pressure: FGVP x 0.0555 The WPB derived fan performance measurements were compared to the manufacturers fan performance specifications. The following graphs give the performance comparison. |
|
*Scroll down to see all fan data comparisons
|
|
|
System Photos Lots of other Info WPB Home Page Go to Fan Tests |
|
|
This comparison of fan performance was undertaken to be able to compare all the generic radon fans by testing them under identical conditions. A fan testing station was set up at WPB offices. See photo below. Since most sub-slab depressurization systems require at least 10 feet of PVC piping to be able to carry the system exhaust above the roof line all fans were tested with 10 feet of piping. In most cases 4" PVC piping was used. Higher capacity fans were tested with 6 inch PVC piping since this would be the typical minimum piping size for larger airflow setups often used in commercial installations. The drawing below gives the general testing system layout.
|
|
Fan Testing Layout |
|
|
|
|
|
|
|
|
|
|
|
|
|
|
The measurement of each fan performance was carried out by making measurements of the velocity pressure using a flow grid placed in the piping and measuring the static pressure using the reference port of a pitot tube placed in the piping. The inlet to the system had varying amounts of restriction from full open to fully capped. See restriction caps in photo above. During each restriction the velocity pressure, static pressure and wattage were measured and recorded. The micro-monometer was a Energy Conservatory DG-700 that has automatic zeroing and is capable of reading down to 0.1 pascals with a margin of error of one percent. All pressure readings were ten second averages. This study was designed to make measurements that have a total measurement error less than 10%. It was discovered during the testing that at zero airflow the maximum static pressure of each fan would decrease 3% to 6% over an hour's time as the fan motor heated up. The current testing procedure is to record the capped pipe static pressure after the fan has run for one hour at zero airflow and then run the fan with the smallest inlet size cap for 30 minutes to allow the fan motor to obtain normal airflow temperature. The smallest inlet cap only creates about a 1% drop in static pressure from heat generation. The remaining restriction caps are each then tested in sequence without long run times. The fan wattage was measured using a "Watts Up?/Pro" electric watt meter available from Watt Meter. A critical component of measuring fan performance is having a flow measuring device that has been calibrated. This study used a pitot tube flow grid that was provided by Infiltec. Infiltec is an infiltration instrument manufacturer that makes blower doors used in measuring building airtightness. The flow grid velocity pressure was measured under 10 different known airflow velocities at the RadonAway fan manufacturer factory in their fan testing laboratory. The average of these measurements at the nine higher airflow rates was averaged. The average calibration factor that cross referenced to the airflow velocities was used as the calibration factor for all the fan performance tests. Airflow velocity measurements are influenced by the air density at the time of the measurement. To adjust for this factor the air density was calculated during each fan performance testing run. This was done by measuring the test site temperature and humidity. The current barometric measurement was determined by checking the local weather on the internet for the nearest town. The calculation of the air density was made by using a NIST simplified air density formula. The NIST formula provided here needs to be converted from metric units to english units. The velocity pressure conversion to CFM is then determined by using the flowgrid calibration factor previously determined and the air density using the following formula.
CFM = FGCF x square root of FGVP / AD Where: CFM - cubic feet per minute FGCF - Flowgrid calibration factor FGVP - Flowgrid velocity pressure in inches of water column AD - Air density in lbs/cubic foot (use 0.075 if unknown)
The static pressure induced by the fans under differing airflow and resistance was measured by placing a pitot tube in the middle of the air stream approximately 12" before the inlet to the fan. The reference side of the pitot tube was then measured with ten second averages using the same dual channel micro-monometer. There is approximately three additional feet of open piping from the pitot tube to the fan exhaust location. This small amount of resistance was added to the static pressure reading by mathematically calculating the resistance based on the system airflow and a factor determined from an ASHRAE piping airflow pressure loss in piping chart. The two additional feet of PVC piping added the following additional static pressure: FGVP x 0.0555 The WPB derived fan performance measurements were compared to the manufacturers fan performance specifications. The following graphs give the performance comparison. |
|
*Scroll down to see all fan data comparisons
|
|
|
System Photos Lots of other Info WPB Home Page Go to Fan Tests |
|
|
|
|
|
Radon mitigation call Integra Environmental 610 346-8004 |